he world of cryptocurrency is fast-paced and constantly evolving, and one of the most important tools for investors and traders is the Bitcoin price chart. Whether you are a beginner or an experienced trader, understanding how to read and analyze Bitcoin price charts is essential for making informed decisions. These charts provide valuable insights into market trends, price movements, and potential future behavior of Bitcoin.
What Is a Bitcoin Price Chart
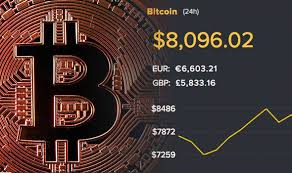
A Bitcoin price chart is a graphical representation of the price of Bitcoin over a specific period of time. It shows how the value of Bitcoin changes based on market demand and supply. These charts can display data in different timeframes, such as minutes, hours, days, or even years, allowing users to analyze both short-term and long-term trends.
Types of Bitcoin Price Charts
There are several types of Bitcoin price charts used by traders. Line charts are the simplest, showing the closing price over time. Bar charts provide more detailed information, including opening, closing, high, and low prices. Candlestick charts are the most popular, as they visually represent price movements and patterns. Each type of chart serves a different purpose and helps traders understand the market more effectively.
How to Read a Bitcoin Price Chart
Reading a Bitcoin price chart involves understanding key elements such as price, time, and volume. The horizontal axis represents time, while the vertical axis shows price levels. Candlesticks indicate whether the price has increased or decreased during a specific period. Green candles usually represent price increases, while red candles indicate decreases. Volume bars show how much Bitcoin was traded during a given timeframe.
Key Indicators in Bitcoin Price Charts
Several indicators help traders analyze Bitcoin price charts. Moving averages smooth out price data to identify trends. Relative Strength Index (RSI) measures whether Bitcoin is overbought or oversold. Support and resistance levels indicate where prices tend to stop and reverse. These indicators provide insights into market behavior and help traders make better decisions.
Importance of Bitcoin Price Charts
Bitcoin price charts are essential for understanding market trends and predicting future movements. They help traders identify patterns, such as bullish or bearish trends. Investors use charts to determine the best time to buy or sell Bitcoin. By analyzing historical data, users can make more informed decisions and reduce risks.
Factors Affecting Bitcoin Price
Several factors influence the price of Bitcoin. Market demand and supply play a major role. News and events related to cryptocurrency can cause price fluctuations. Government regulations and economic conditions also impact the market. Additionally, large investors, often called “whales,” can influence price movements through significant trades.
Benefits of Using Bitcoin Price Charts
Using Bitcoin price charts offers many advantages. They provide real-time data, allowing traders to react quickly to market changes. Charts help identify trends and patterns, improving decision-making. They also enable users to set entry and exit points for trades. Overall, Bitcoin price charts are a powerful tool for managing investments.
Common Mistakes to Avoid
Many beginners make mistakes when using Bitcoin price charts. One common mistake is relying on a single indicator instead of combining multiple tools. Another is ignoring market news, which can significantly impact prices. Emotional trading, such as panic buying or selling, can also lead to losses. Learning to analyze charts objectively is key to success.
Future of Bitcoin Price Analysis
As technology advances, Bitcoin price analysis is becoming more sophisticated. Artificial intelligence and machine learning are being used to predict price movements more accurately. Advanced charting tools and platforms provide deeper insights into market behavior. These innovations will continue to improve how traders analyze Bitcoin price charts.
Conclusion
The Bitcoin price chart is an essential tool for anyone involved in cryptocurrency. It provides valuable insights into market trends, helping users make informed decisions. By understanding how to read and analyze these charts, you can improve your trading strategies and reduce risks. As the cryptocurrency market continues to grow, mastering Bitcoin price charts will remain a crucial skill for success.


Leave a Reply